01 — Storytelling
Interactive data storytelling.
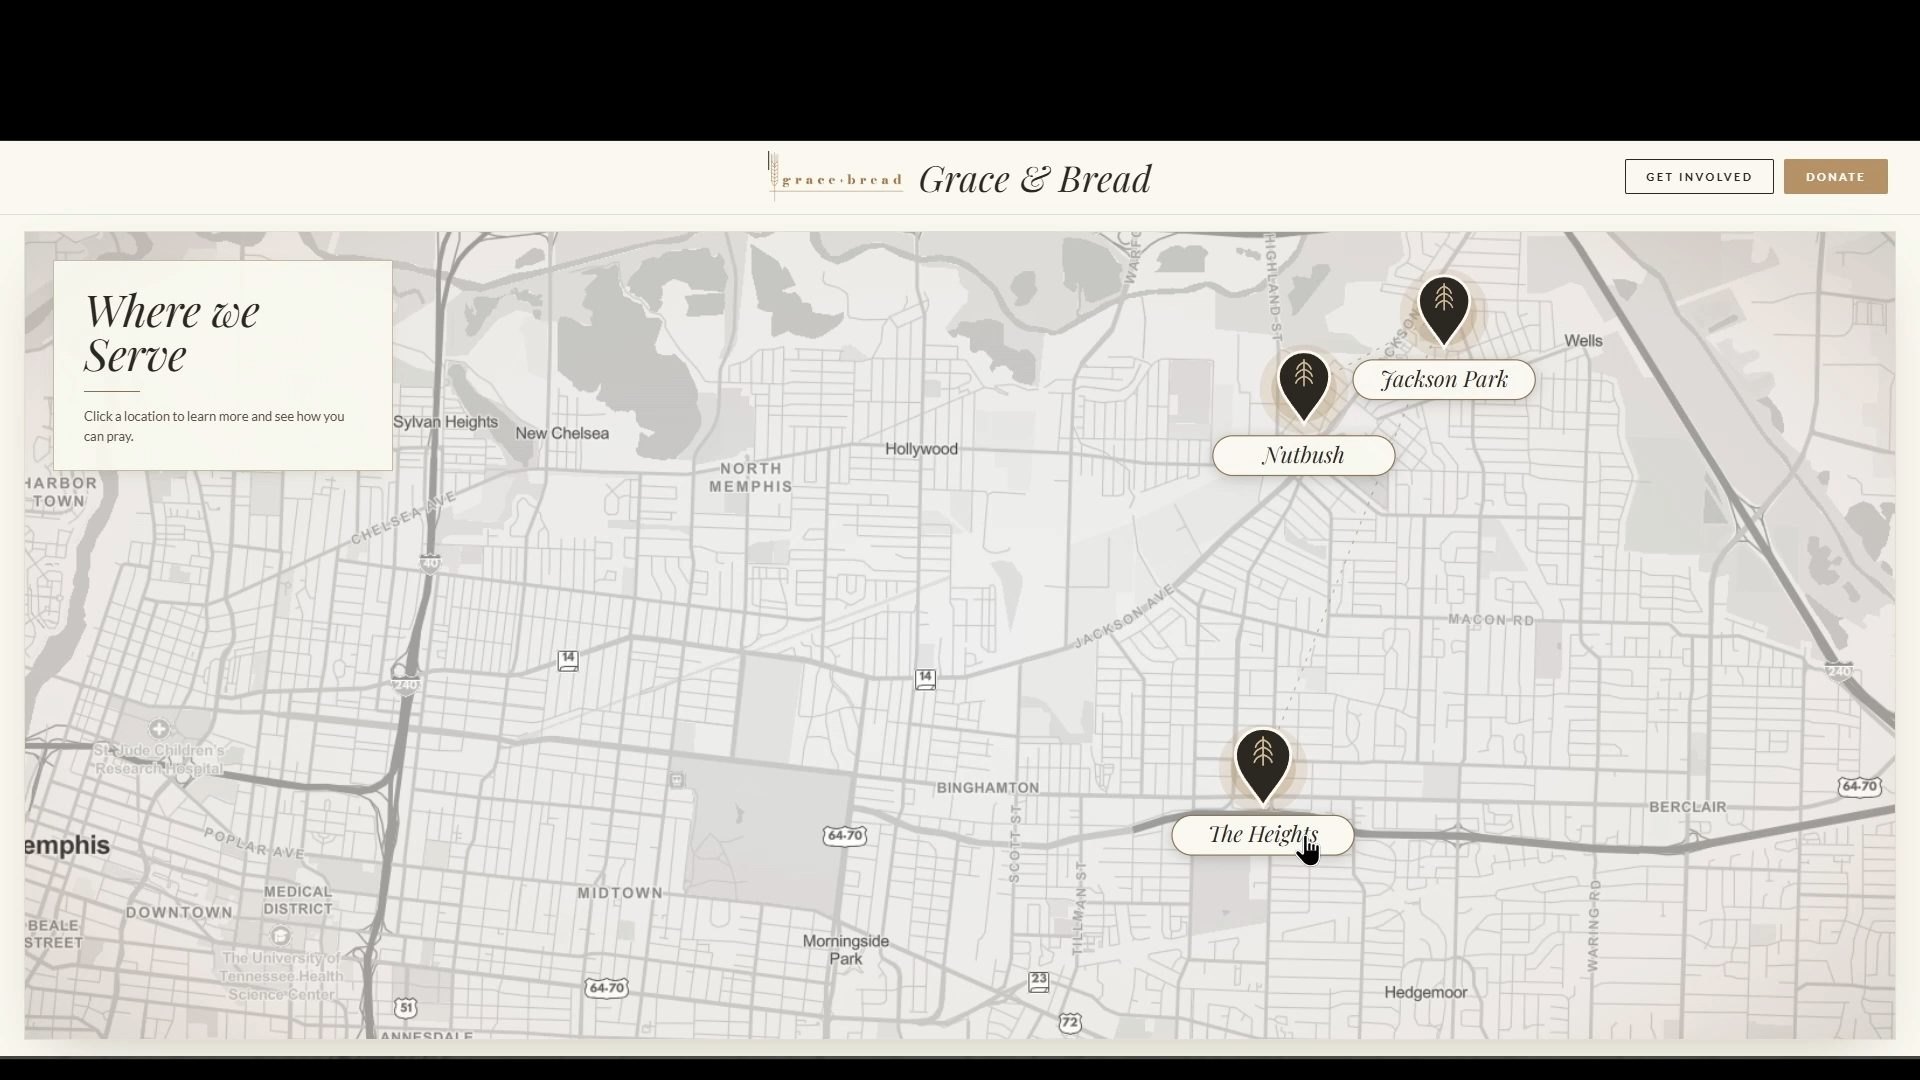
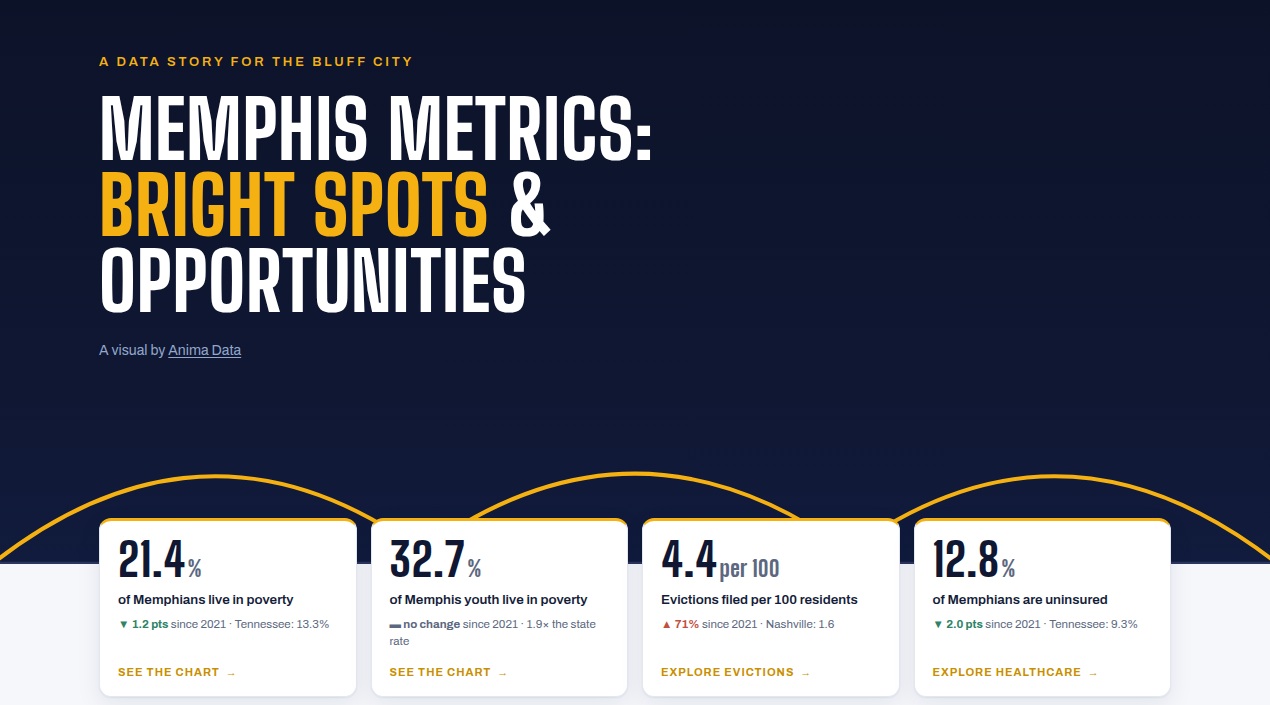
Scrollytelling pieces, explorable narratives, and web-first stories that let your audience move through the data themselves and answer their own questions.
This is what we reach for when the story has more than one chapter, or when the data rewards attention. A reader scrolls, hovers, drills down, and finds the moment your work was always pointing to while exploring the parts that pique their interest most. They leave having had a meaningful connection with your data story.
Case studyInteractive data storytelling · 2026
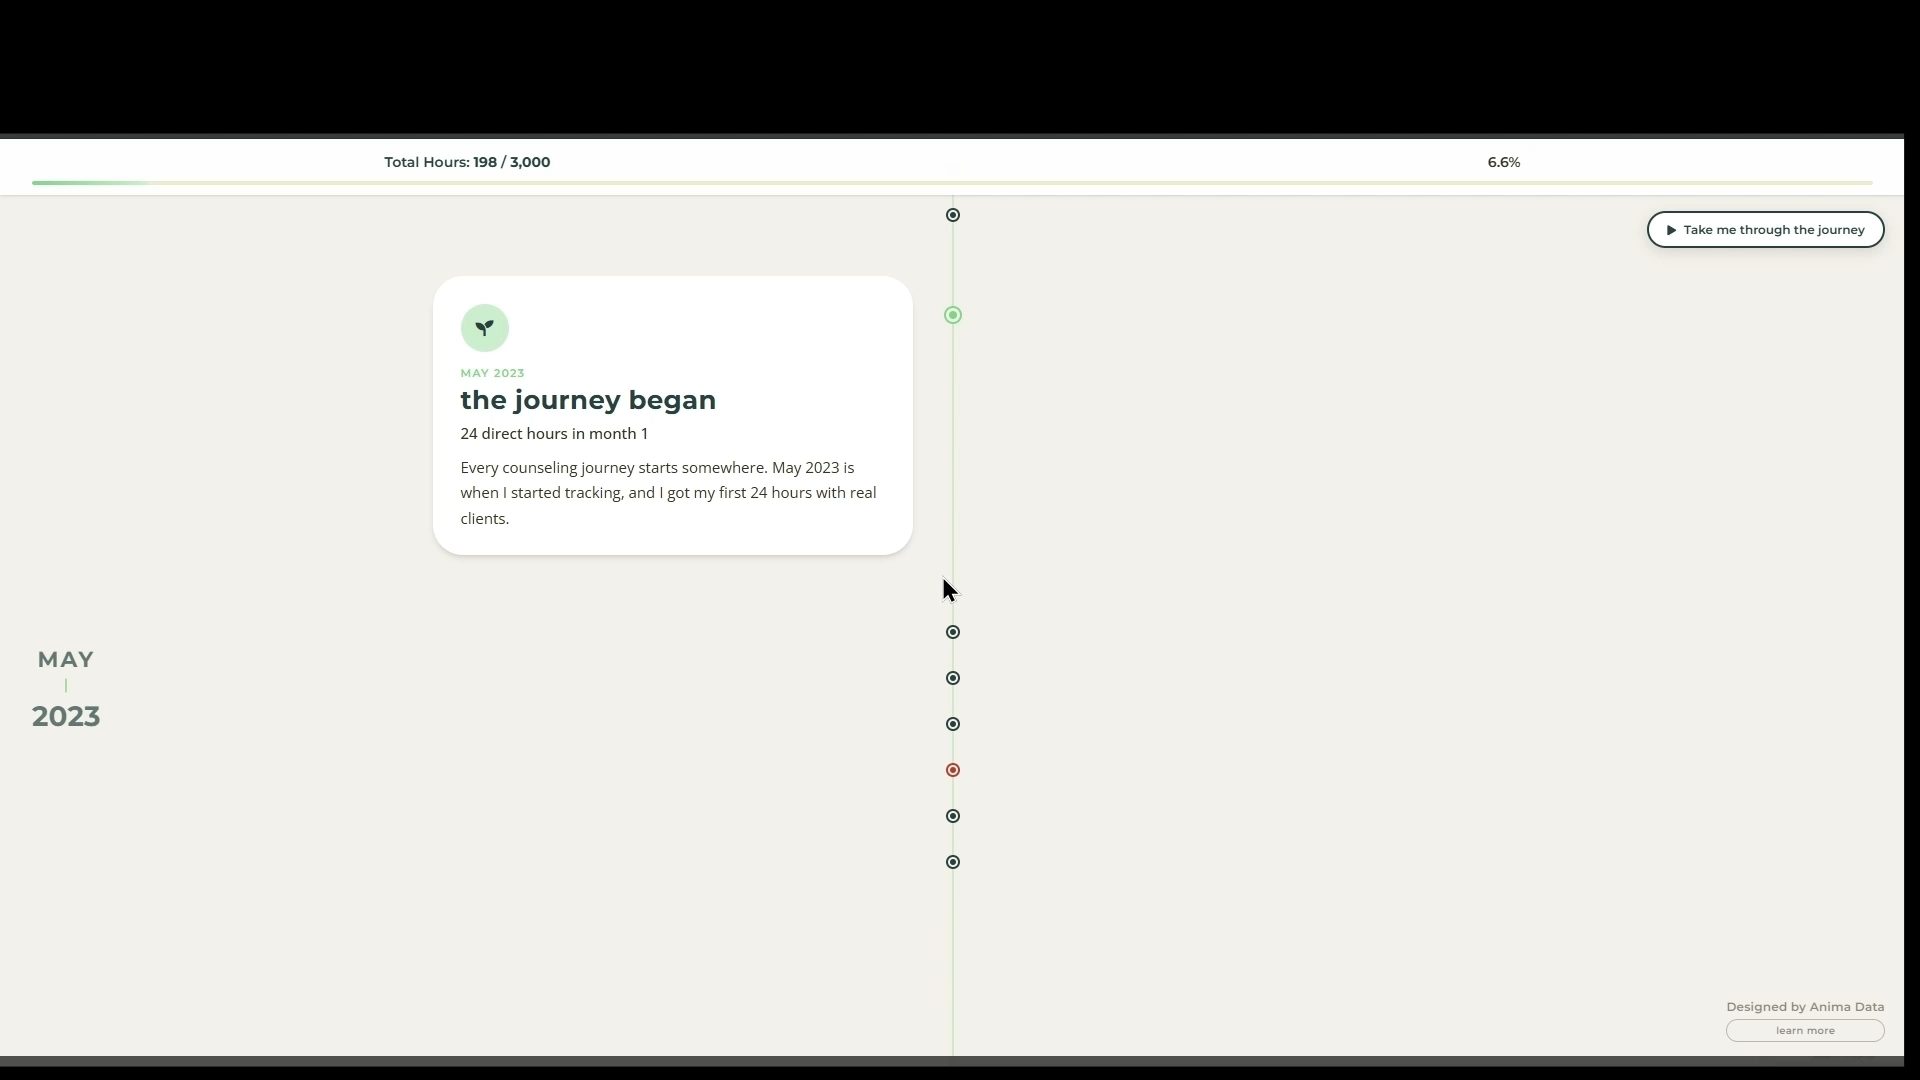
Scrollable timelineInteractive data storytelling · 2026
An interactive timeline that showcases a professional journey, not just hours logged.
Are you a coach, therapist, or financial advisor? We offer a dedicated timeline product designed specifically for practitioners whose About page isn't winning them bookings.
See the offer →